
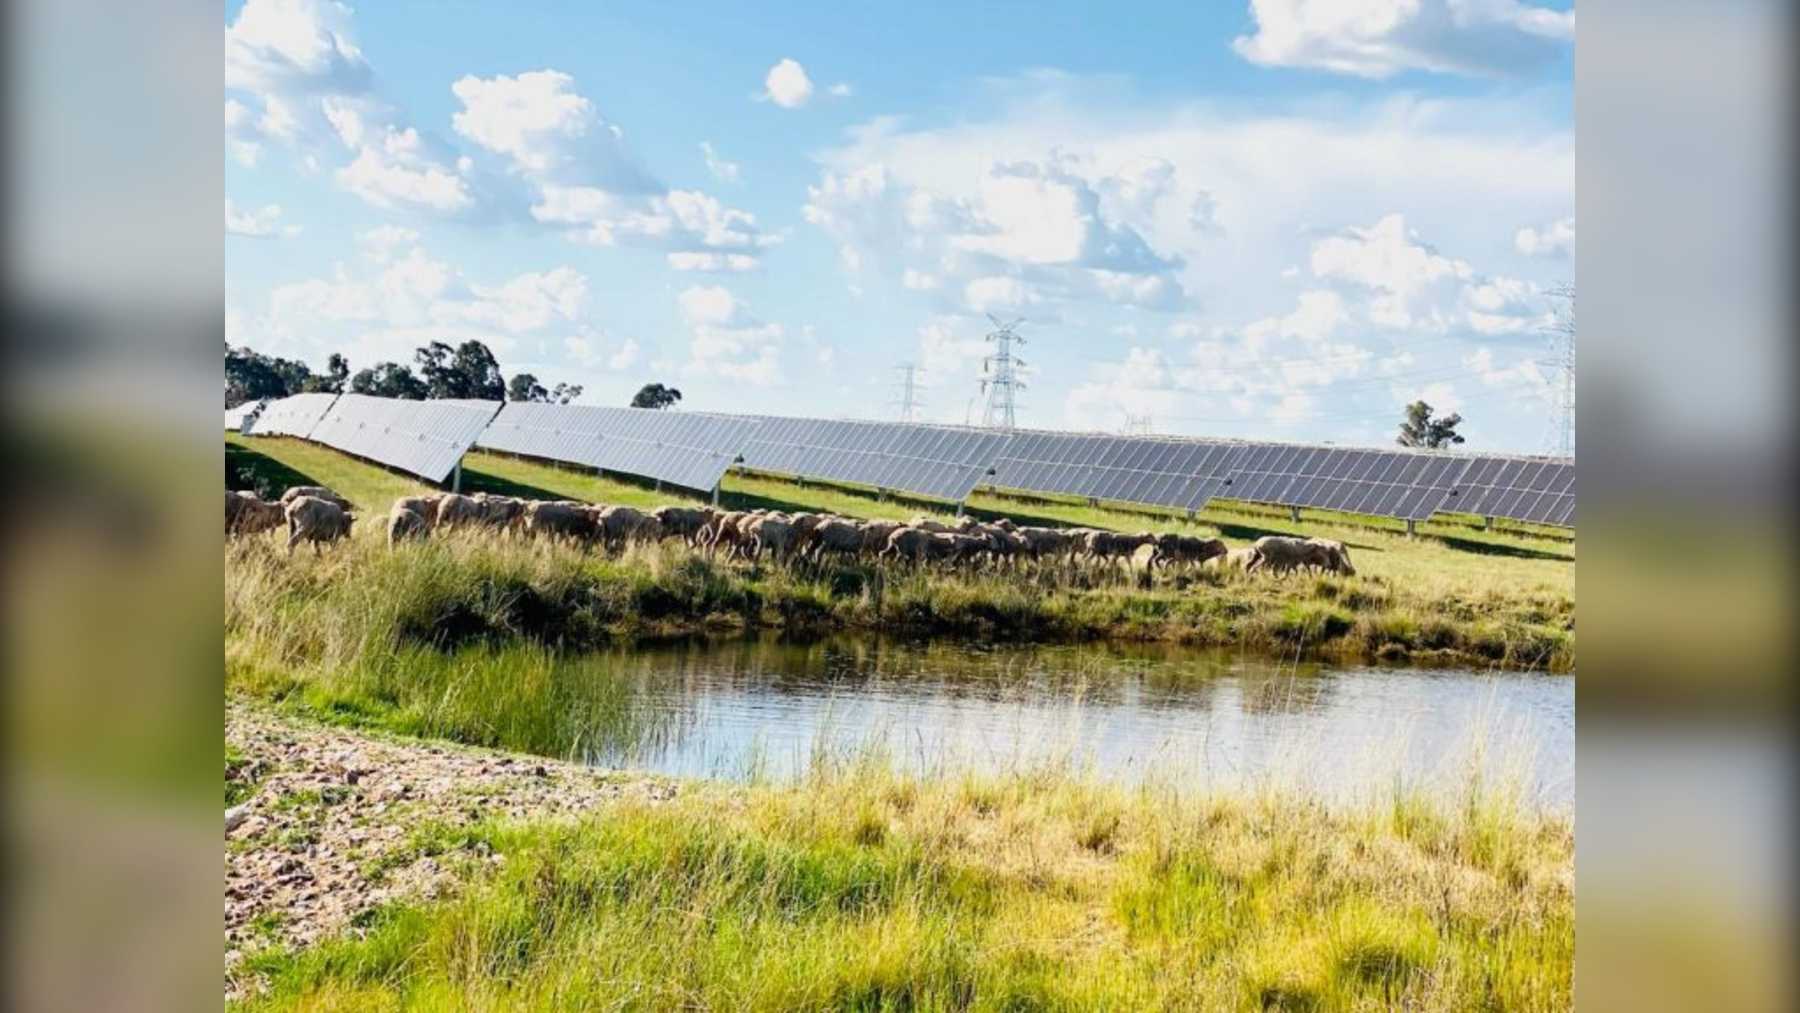
On a farm near Gulgong, in the central-west of New South Wales, a flock of 250 sheep grazes between the rows of panels at the Stubbo plant, which topped last month Australia’s photovoltaic plant rankings. Large-scale solar hit generation highs in September 2026 across New South Wales, Queensland and Victoria, according to monthly data from energy consultancy Rystad Energy.
Adding solar and large-scale wind together, the country produced 5.44 terawatt-hours (TWh) in a single month. That is 7% above the 5.1 TWh recorded in September 2025 and above the 4.99 TWh of August.
Three States Reach Solar Highs
The figures were released by David Dixon, senior analyst at Rystad Energy, in his monthly roundup on LinkedIn, and were picked up by pv magazine Australia, RenewEconomy and PV Tech.
New South Wales generated 841 GWh from its photovoltaic plants, Queensland 645 GWh and Victoria 267 GWh. According to PV Tech, for all three states this marks the largest solar generation ever recorded for a September month.
One gigawatt-hour equals one thousand megawatt-hours, and one terawatt-hour equals one thousand gigawatt-hours, so the 5.44 TWh for the month translates to 5,440 GWh.
Victoria was the state contributing the most clean energy when combining both technologies, totaling 1.52 TWh. Of that, 1.25 TWh came from its wind farms and about 0.27 TWh from large-scale solar, according to the breakdown published by RenewEconomy.
Stubbo Tops the Ranking
Stubbo, from Acen Australia, led the month’s solar-plant ranking with 400 MW and an average alternating-current capacity factor of 35%. That factor measures how much electricity a plant produces compared with what it would generate if operating at full power 24/7.
Stubbo began full commercial operation in late 2025, about 10 kilometers north of Gulgong. RenewEconomy recalls that Acen has said it could add a 200 MW battery with 800 MWh of storage.
With the same 35%, two Queensland plants also ended up with the same rate: Columboola, a 162 MW facility owned by Korea’s Hana Financial Investment, and Edenvale, a 204 MW plant operated by Japan’s ENEOS and Sojitz.
Sheep Among the Panels
Stubbo’s strong month coincided with the arrival of those 250 sheep, part of a land-sharing model that Acen applies for grazing, land stewardship and wildfire prevention. It’s the same concept already tested with sheep at solar parks in Tennessee.
“Agriculture and renewables don’t have to compete for land,” the company told pv magazine Australia. “At Stubbo Solar we are proud to show that farming and clean energy generation can go hand in hand, supporting local agricultural practices while delivering renewable power to Australia’s grid.”
Acen added that grazing keeps the land productive and eases plant management. “It’s a simple yet effective example of how renewable projects can continue to support agricultural activity and create shared value for rural communities,” the company said.
Less Solar Power Curtailment
In the National Electricity Market (NEM), the grid connecting the eastern and southern states, September saw a 22% cut of available solar generation, compared with 26% a year earlier. That cut, or curtailment, is energy that plants could produce but do not inject because the grid does not need or cannot carry it.
Dixon noted that curtailment remained high in September, “as always,” though it is gradually easing. In August, PV Tech reported that NEM solar curtailment had fallen to around 9%, from 18% a year earlier.
Storage is one piece of the solution to better utilize these surpluses, with projects such as the Waratah battery, 850 MW, in New South Wales.
Gas Falls to September Low
The other side of the month lies with gas-fired plants. “Gas generation in the NEM totaled only 455 GWh in September, the first time gas generation fell below 500 GWh in a September month,” Dixon wrote.
PV Tech adds that wholesale prices averaged below A$65 per MWh across all NEM states, and below A$40 in South Australia, Tasmania and Victoria. South Australia has already seen a 30% drop in electricity prices in a year tied to renewables.
Wind Remains Flat
The wind did not cooperate to the same extent. September wind generation was similar to or lower than last year in all states except Queensland, and overall it fell by about 86 GWh compared with September 2025, with roughly 13% of the available output curtailed in the NEM.
The most productive wind farms were Flat Rocks in Western Australia, with a capacity factor of 55%, followed by Cattle Hill (49%) and Granville Harbour (48%), both in Tasmania. Flat Rocks lies outside the NEM since Western Australia has its own grid.
What the Figures Do Not Tell
The data are a monthly balance from Rystad and not official statistics from the grid operator, and the outlets reporting them do not fully agree. pv magazine Australia cites 276 GWh for Victoria’s solar, while RenewEconomy and PV Tech quote 267 GWh.
Nor should this large-scale solar be conflated with all the country’s solar capacity, as rooftop solar, which carries considerable weight in Australia, is treated separately. And a September peak is not an annual peak, as solar output continues to rise with the Australian spring.
The data come from Rystad Energy’s monthly review captured on October 6, 2026, by pv magazine Australia.
Meanwhile, an Australian factory has already tested combining solar panels with a green roof to squeeze more value from the sun.
Image: ACEN Australia