
The water footprint is the amount of fresh water used or polluted, directly or indirectly, to produce something, and it is measured in liters: on average, one kilogram of beef requires about 15,400 liters, according to the report by Mesfin Mekonnen and Arjen Hoekstra on animal products, published by UNESCO-IHE in 2010 and revised in 2012 in the journal Ecosystems. That figure, like all those shown here, is a global average for the period 1996-2005 (not data from a single farm or country).
Behind every figure there are three distinct waters, which the same authors describe with colors in a 2011 article in the journal Hydrology and Earth System Sciences. The blue water footprint is the water from rivers, reservoirs and aquifers that is consumed (evaporated) during production. The green water footprint is the rainfall that the plants use. The gray water footprint is a theoretical volume: the fresh water that would be needed to assimilate the pollution produced by the process without exceeding environmental quality standards.
The breakdown for beef helps to understand it. The report’s table assigns 15,415 liters per kilogram, of which 14,414 are green, 550 blue and 451 gray. More than 93% is therefore rainfall consumed by the pastures and the crops that fed the animals, and in animal production overall feed accounts for 98% of the water. The water that comes from rivers, reservoirs or wells is that 550 liters.
Green water also dominates agriculture as a whole. The planet’s crops had, between 1996 and 2005, a water footprint of 7,404 cubic kilometers per year, with 78% green water, 12% blue and 10% gray, according to the summary of the same 2011 study. Wheat, rice and maize are the crops with the largest total footprint, and wheat and rice alone account for 45% of the world’s blue water footprint.
Liters per kilogram, from tomato to cocoa
The figures for plant-based products come from Table 3 of the 2011 article, and those for animals from the 2010 report. All three footprints are added together and expressed in liters per kilogram, which corresponds to cubic meters per ton as published by the authors.
| Product | Liters per kilogram (worldwide average 1996-2005) |
|---|---|
| Cocoa beans | 19,928 |
| Roasted coffee | 18,925 |
| Chocolate | 17,196 |
| Beef | 15,400 |
| Virgin olive oil | 14,431 |
| Lamb | 10,400 |
| Pork | 6,000 |
| Butter | 5,553 |
| Chicken | 4,300 |
| Eggs | 3,300 |
| Olives | 3,015 |
| Wheat | 1,827 |
| Unhusked rice | 1,673 |
| Wheat bread | 1,608 |
| Corn | 1,222 |
| Cow’s milk | 1,000 |
| Apples | 822 |
| Bananas | 790 |
| Oranges | 560 |
| Malted beer | 298 |
| Potatoes | 287 |
| Tomatoes | 214 |
Finished products inherit the water from their raw material. Roasted coffee exceeds green coffee (15,897 liters per kilogram), and virgin olive oil multiplies almost fivefold the figure for the olive. At the other end, tomatoes, potatoes and beer do not exceed 300 liters per kilogram.
By food groups, the 2010 report places sugar at 197 liters per kilogram, vegetables at 322, roots and tubers at 387, and fruits at 962. Cereals reach 1,644. Oilseeds, 2,364. Legumes, 4,055, and nuts, 9,063.
Now, however, a kilogram does not tell the whole story. By weight, legumes are close to chicken (4,055 versus 4,300 liters), but the report also accounts by nutrient: for every gram of protein, the footprint of beef is six times that of legumes, and per calorie, it is twenty times that of cereals and roots.
How the water footprint is calculated
The basic calculation is a sum: blue footprint plus green footprint plus gray footprint. In a crop, one measures the irrigation water (blue) and rainfall (green) consumed by the plant, and adds the gray volume corresponding to the pollution generated. In a finished product, the footprint accumulates everything that enters the chain, and that is why meat’s footprint depends almost entirely on feed. On a global scale, animal production uses about 2,422 billion cubic meters of water per year (87.2% green, 6.2% blue and 6.6% gray). A third of it corresponds to beef cattle and 19% to dairy cattle.
To perform the calculation there are two reference frameworks. One is the Water Footprint Network, whose evaluation manual is distributed by AENOR in Spanish, as ECOticias explained in 2021 when presenting the Water Footprint Network manual. The other is the ISO 14046 standard. Both work with the product life cycle, but ISO focuses on quantifying water consumed, while the Water Footprint Network scheme also assesses environmental impacts.
That assessment places the footprint in context. The Water Footprint Network website links the blue footprint to blue water scarcity, which helps measure its environmental sustainability, and the gray footprint to pollution, because it compares it with the environment’s capacity to assimilate contaminants. In this way, the same volume of blue water weighs more where less is available (ECOticias has already explained what the water reserve is and why it matters).
Where is the margin for reducing it
The 2010 report states, in its summary, that from a water perspective it is more efficient to obtain calories, proteins and fats from crops than from animal products. With the table in front of you, the margin is mainly in what ends up on the plate.
Replacing a kilogram of beef with a kilogram of chicken lowers the footprint per kilogram from 15,400 to 4,300 liters, a reduction of about 11,100 liters. Pork stays at 6,000 and lamb at 10,400. Legumes, at 4,055 liters per kilogram, also provide protein with six times less water per gram than beef. And cereals, potatoes and the rest of roots and tubers deliver each calorie with a twentieth of the water that beef requires.
Household taps also matter, although they weigh less in the overall total. According to FAO AQUASTAT, of all the fresh water extracted worldwide, 69% goes to agriculture, 19% to industry, and 12% to municipal use, which includes domestic use and forms the urban water cycle from capture to treatment. That statistic measures withdrawals, so it excludes the rainfall that crops consume, which is the largest portion of the water footprint of foods.
The water in a T-shirt or jeans
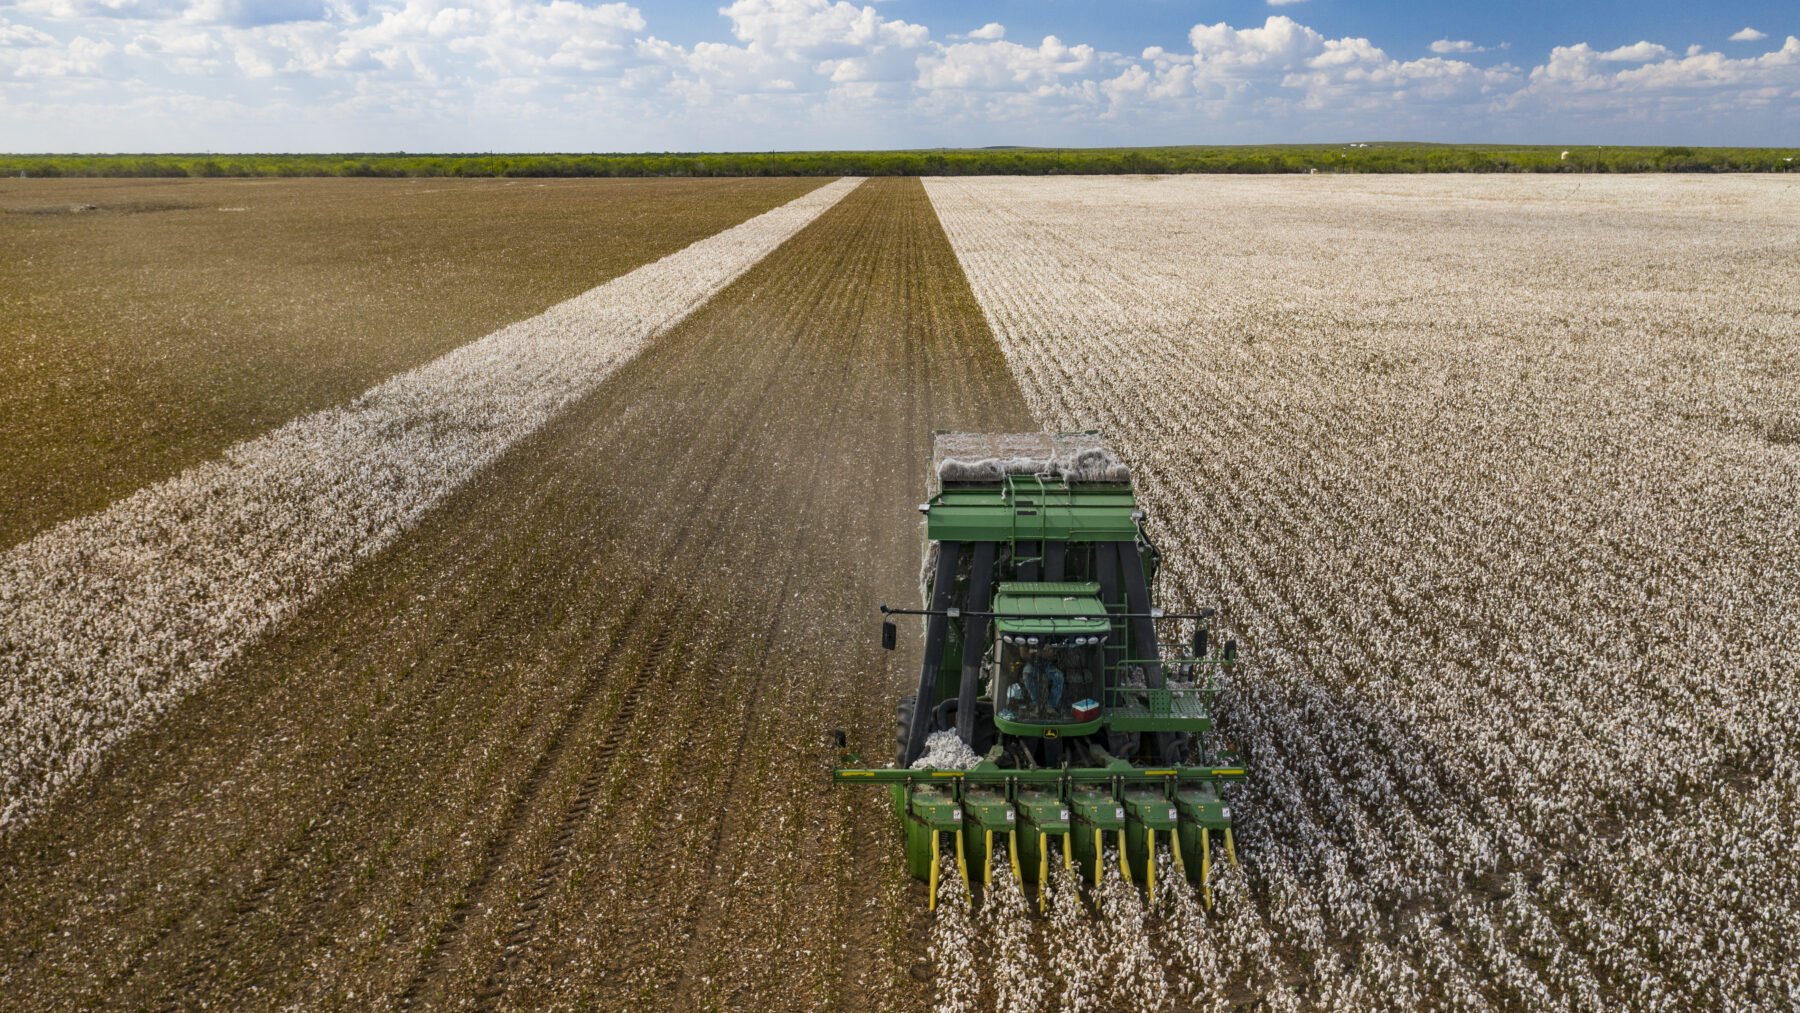
Cotton clothing drags water from the field. The 2011 article’s table gives 4,029 liters per kilogram for cottonseed, 9,113 for the fiber (already separated from the seed), and 9,982 for the finished cotton fabric. Those sources do not provide a per-item figure, so the calculation depends on weight: a 200-gram T-shirt would be around 2,000 liters, and a 600-gram pair of cotton jeans about 6,000 liters.
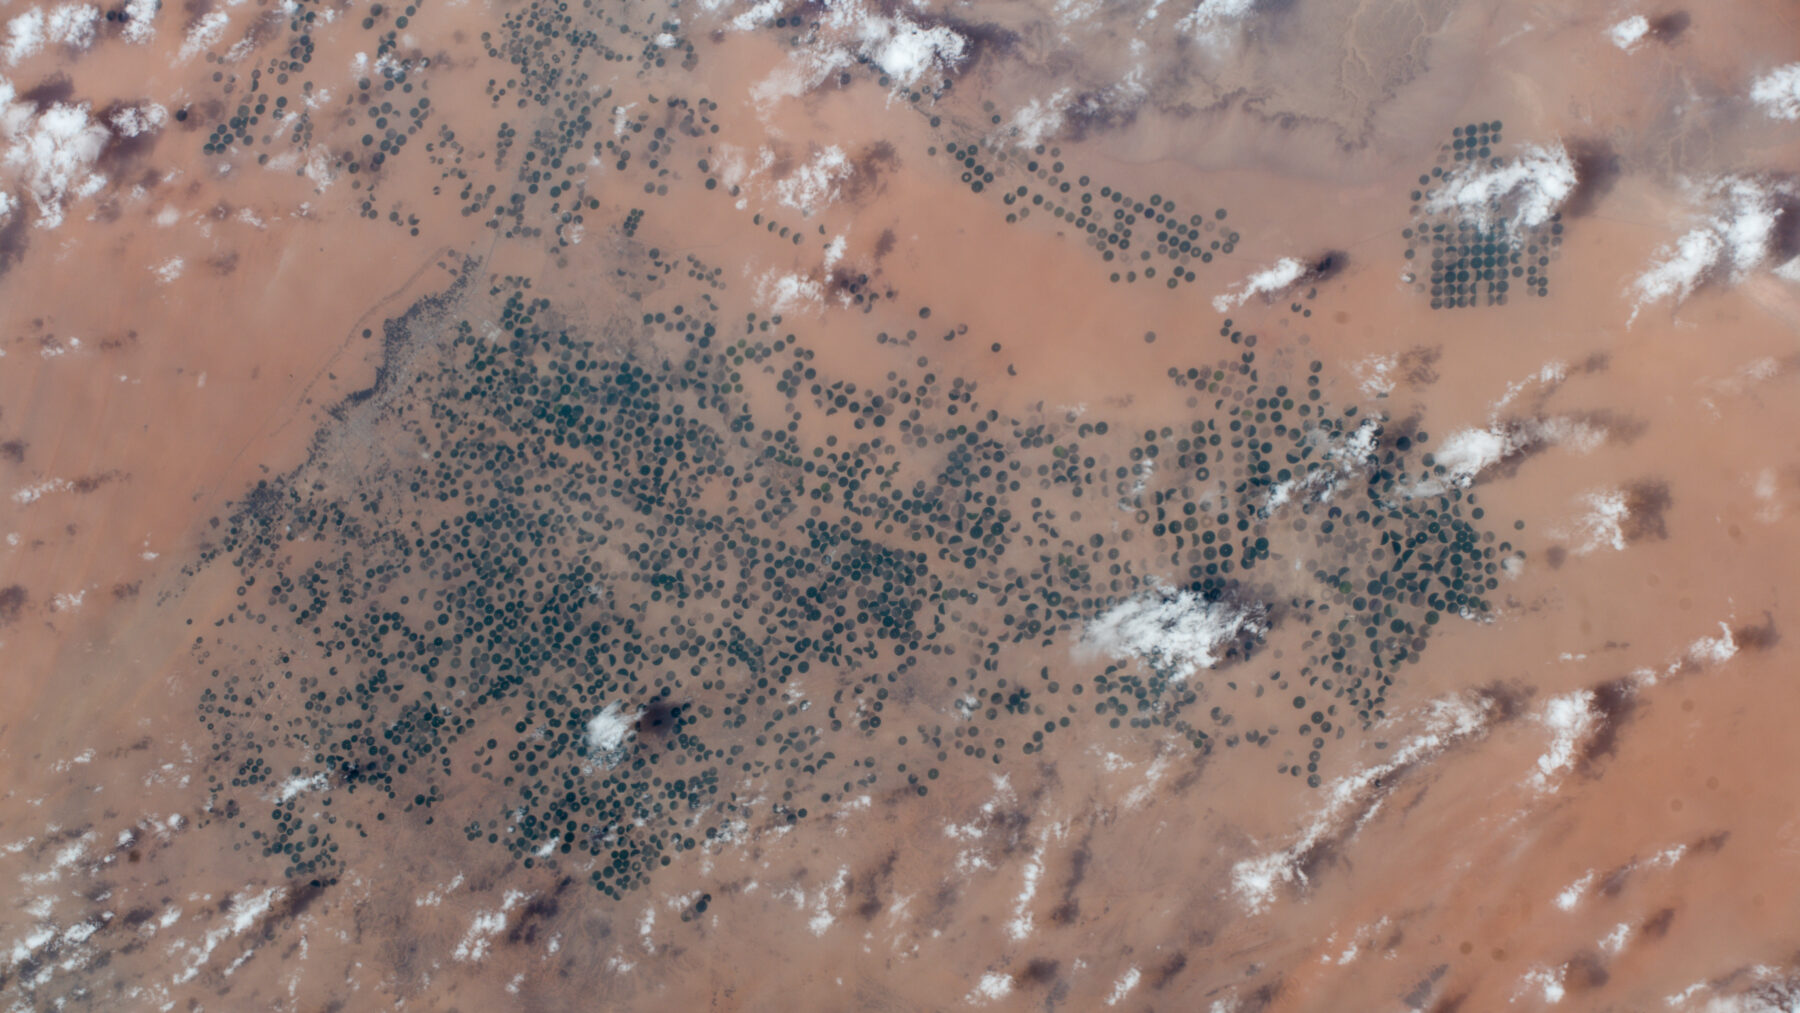
The figure extends to the finished fabric and, like the rest, is a global average for 1996-2005 that does not indicate where the cotton was grown. The garment’s production is outside of the count.