
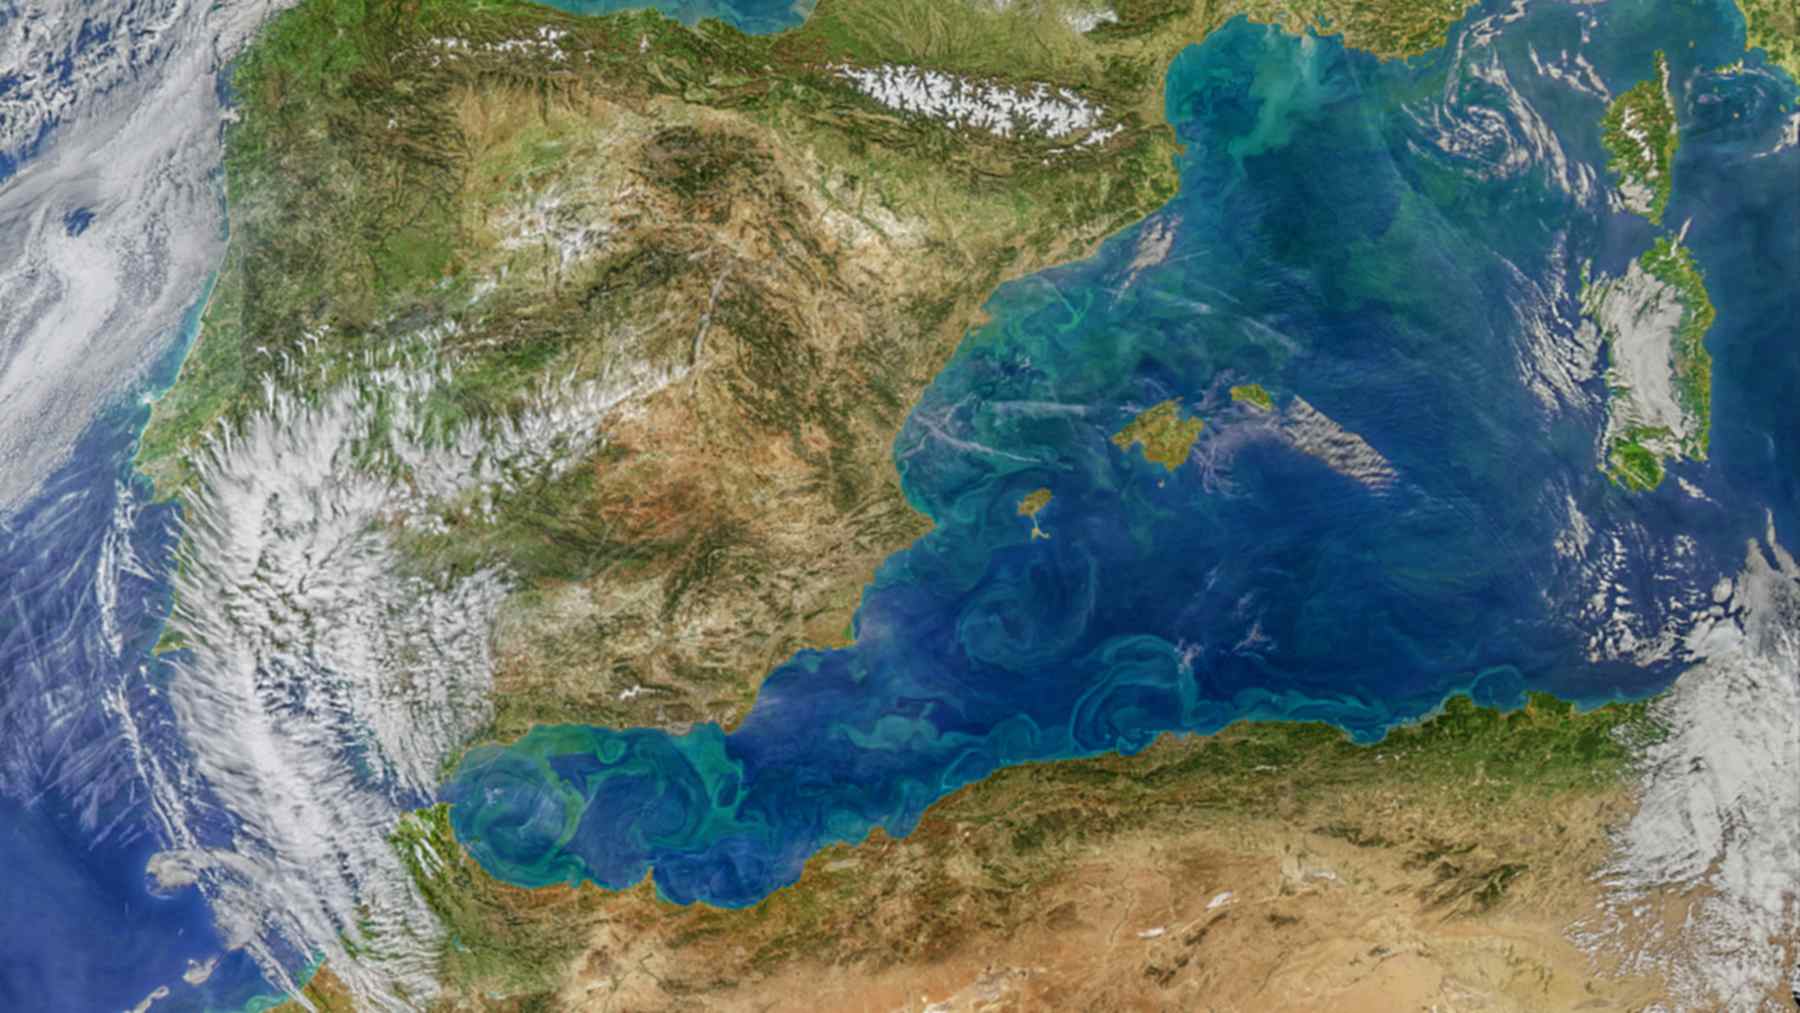
The eddies of the western Mediterranean carry, on some days, considerably more energy than had been estimated with the satellites traditionally used. This has been confirmed by the team led by researcher Laura Gómez-Navarro from the Institute of Marine Sciences (ICM-CSIC), using data from the SWOT satellite, and her work forms part of the 10th Copernicus Ocean State Report, which the ICM summarized in a note on 20 October 2026.
There are days when the difference reaches up to 78%. And it isn’t just a curiosity for physicists. Those eddies strongly influence where the floating debris moves between the coast of North Africa and the Balearic Islands, and with the new data that calculation changes.
A satellite that looks 2D
SWOT is a satellite developed by NASA and the French space agency (CNES). It measures the height of the water surface in broad swaths, in two dimensions, whereas traditional altimeters only record a narrow line beneath their orbit. It is like moving from a slit to a window.
The team compared two current maps of currents from August 2023 to June 2024. One is Copernicus’ reference product, which uses only the usual altimeters, and the other incorporates SWOT measurements. The area chosen is the western Mediterranean, with the Alboran Sea among the most active zones.
Why that area? According to the article, the western Mediterranean hosts activities such as tourism, maritime transport, fishing, and aquaculture. What happens to its currents ends up affecting the wallets of many people.
19 eddies a day, not 12
With SWOT there are many more eddies. In clockwise-rotating ones (the anticyclones), the new map detects an average of 19 per day, versus 12.5 for the classic product. In those that rotate in the opposite direction, the count rises from 16.6 to 20.4.
Much of that difference shows up near the coast, for example west of Corsica. In the Gulf of Lion, moreover, the traditional map tends to merge several small eddies into one large one. In short, it was undercounting them.
More energy almost every day
Then there is kinetic energy, which, to put it plainly, is the force with which the water spins inside each eddy. On 96 of 100 days, the SWOT-based map recorded higher energy than the classic one. On average the difference is about 6%, but on 16 September 2023 it rose to 78%.
Gómez-Navarro explains this in the ICM note in simple terms. According to her, SWOT allows studying the ocean “at smaller scales,” seeing more eddies and better measuring how much energy they carry.
And who does that affect? More people than it may seem, because eddies carry heat, salt, and nutrients from one side of the sea to the other. If they were carrying more than previously thought, the climate models for this area were looking at a somewhat blurry picture.
The trash that travels toward Cabrera
To bring all this down to land, scientists inserted simulated particles (computer-generated) into three eddies off the coast of Algeria and looked at where they were 20 days later. They were not chosen at random, since these eddies have been linked before to floating trash crossing from the African coast to the Balearics and Cabrera National Park, whose marine protection remains pending.
It turns out that the same eddy could retain the particles according to one map and lose them according to the other. If we were talking about plastics, a spill, or fish larvae instead of particles, the difference ceases to be a technicality.
The researcher also emphasizes this. Knowing how strong the currents are helps to understand the ocean’s climate, but it is equally useful for “response to marine pollution or the design of search-and-rescue operations at sea.”
An ever-warming sea
The Copernicus report is coordinated by Mercator Ocean International on behalf of the European Commission, and it is signed by 125 scientists. It does not bring good news. The ocean accumulated a record 23 zettajoules of extra heat in 2025, about 40 times the energy the entire world consumed that year.
Sea level rose at a rate of 4.2 millimeters per year between 2012 and 2025, and ocean acidity has increased by 17% since 1985. In the Mediterranean, the average temperature in 2024 was 1.23 °C above the historical reference. That broth-like water we notice in August has numbers behind it.
There were zones in the Mediterranean and the Black Sea with marine heatwaves more than 4.6 °C above the average for more than 30 consecutive days. And much of that heat sinks tens of meters deep.
More SWOT years are needed
The authors themselves set limits to their work. It isn’t a complete comparison between the two maps, and part of the differences may stem from the method used by each. Moreover, SWOT has only recently been in orbit.
To determine whether the large circulation patterns change will require more years of data. Nevertheless, the move seems clear. When these measurements feed into Copernicus’ daily services, predicting where a patch in the sea will go should become more reliable.
The study has been published in the journal State of the Planet, within the 10th Copernicus Ocean State Report.
Photo: NASA